
Spacing: Unreal vs TUNS
Compare surface coverage and measured spacing consistency at 65,536 particles.
Unreal’s area-weighted sampler balances coverage by triangle area. TUNS also relaxes the spacing between points during the bake. In these captures, TUNS reduced nearest-neighbor spacing variation by 72.2% on the sphere and 64.7% on the skeletal mesh against the area-weighted reference.
Measured spacing consistency
| Reference | Unreal variation | TUNS variation | Less variation |
|---|---|---|---|
| Sphere — area-weighted | 0.520 | 0.145 | 72.2% |
| Skeletal mesh — area-weighted | 0.525 | 0.185 | 64.7% |
| Sphere — ordinary random | 0.581 | 0.145 | 75.1% |
| Skeletal mesh — ordinary random | 0.852 | 0.185 | 78.3% |
Variation is the standard deviation of nearest-neighbor distances divided by their mean; lower means more consistent spacing. The percentage is 100 × (1 − TUNS variation / Unreal variation).
Against Unreal’s area-weighted sampler
Left: Unreal area-weighted sampling. Right: TUNS. Both TUNS banks were freshly GPU baked at 65,536 points, 64 Relaxation Iterations and 32 Integration Samples Per Point.
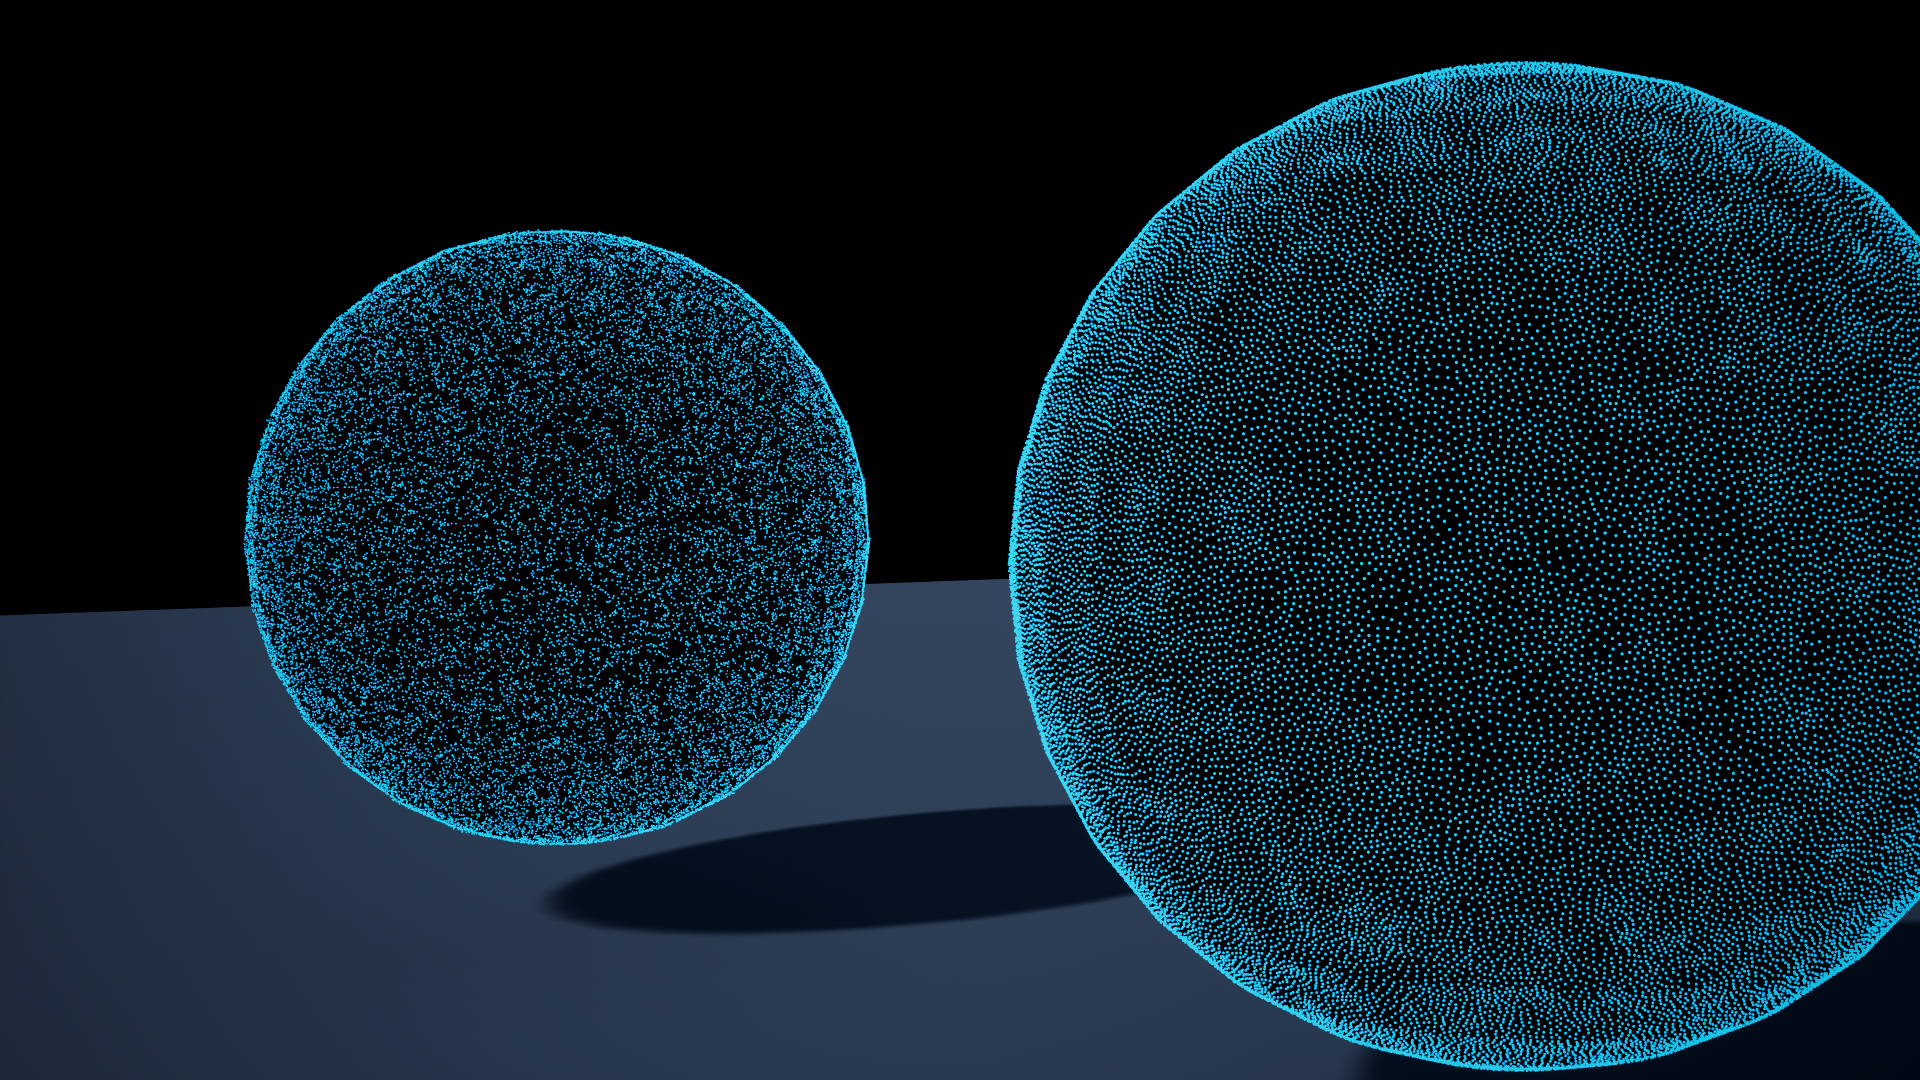
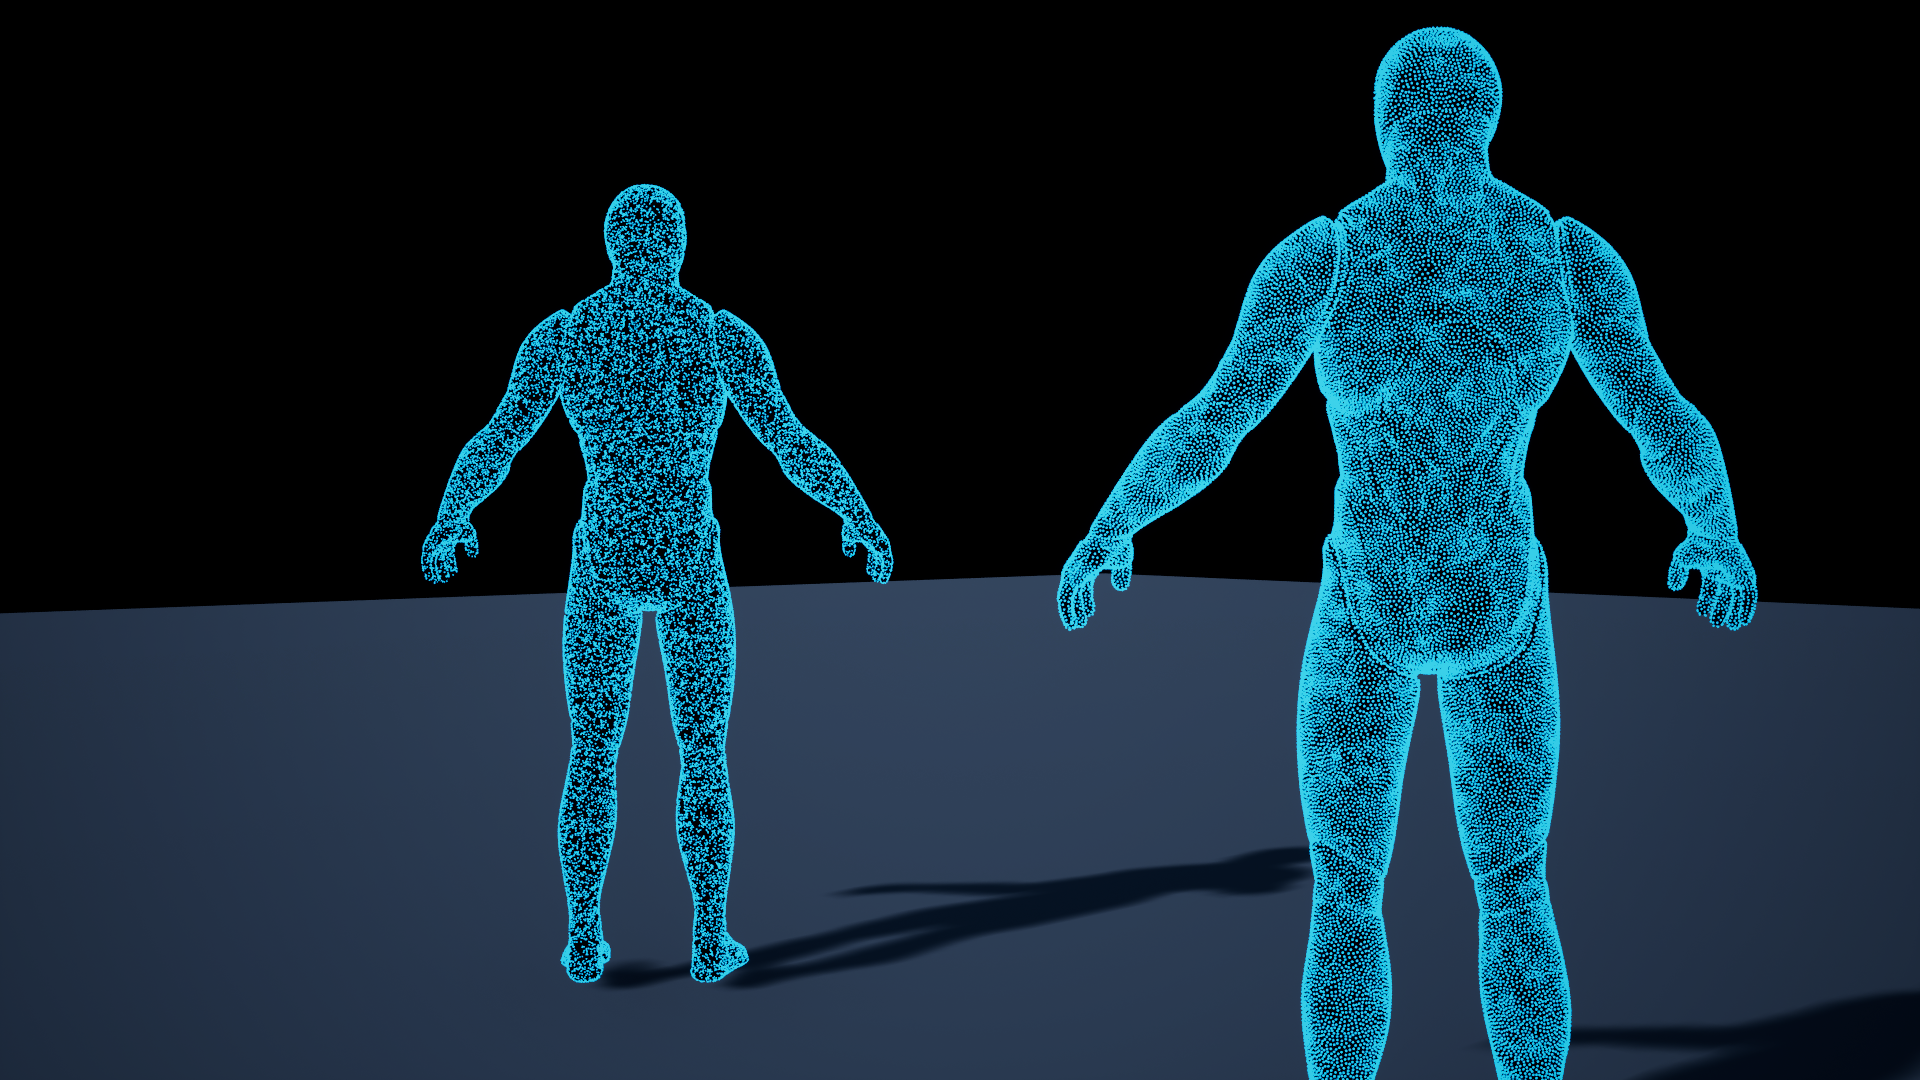
The sphere reference enables CPU and GPU uniform-distribution support. The skeletal reference enables uniform-distribution support on LOD 0, with all 92,178 triangle weights verified. Both use Niagara’s native RandomTriangle function.
Against ordinary random triangle sampling
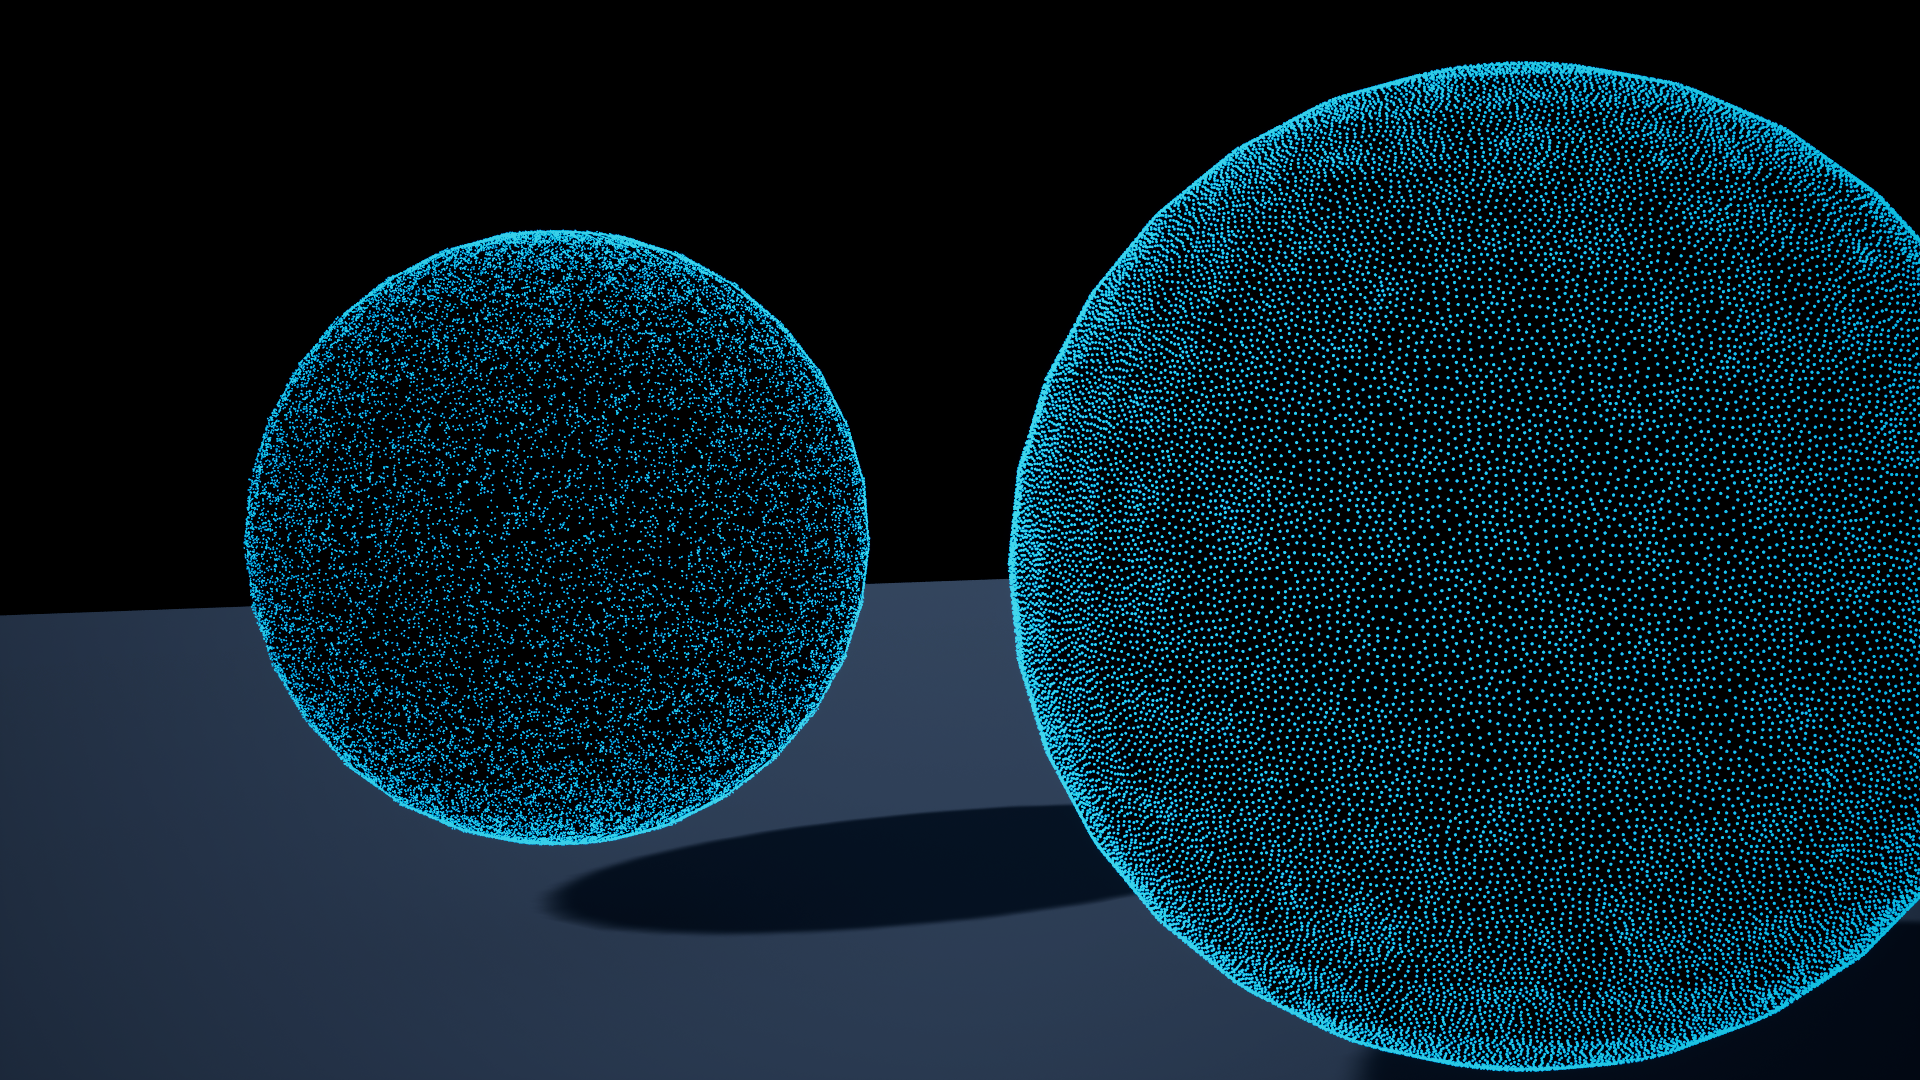
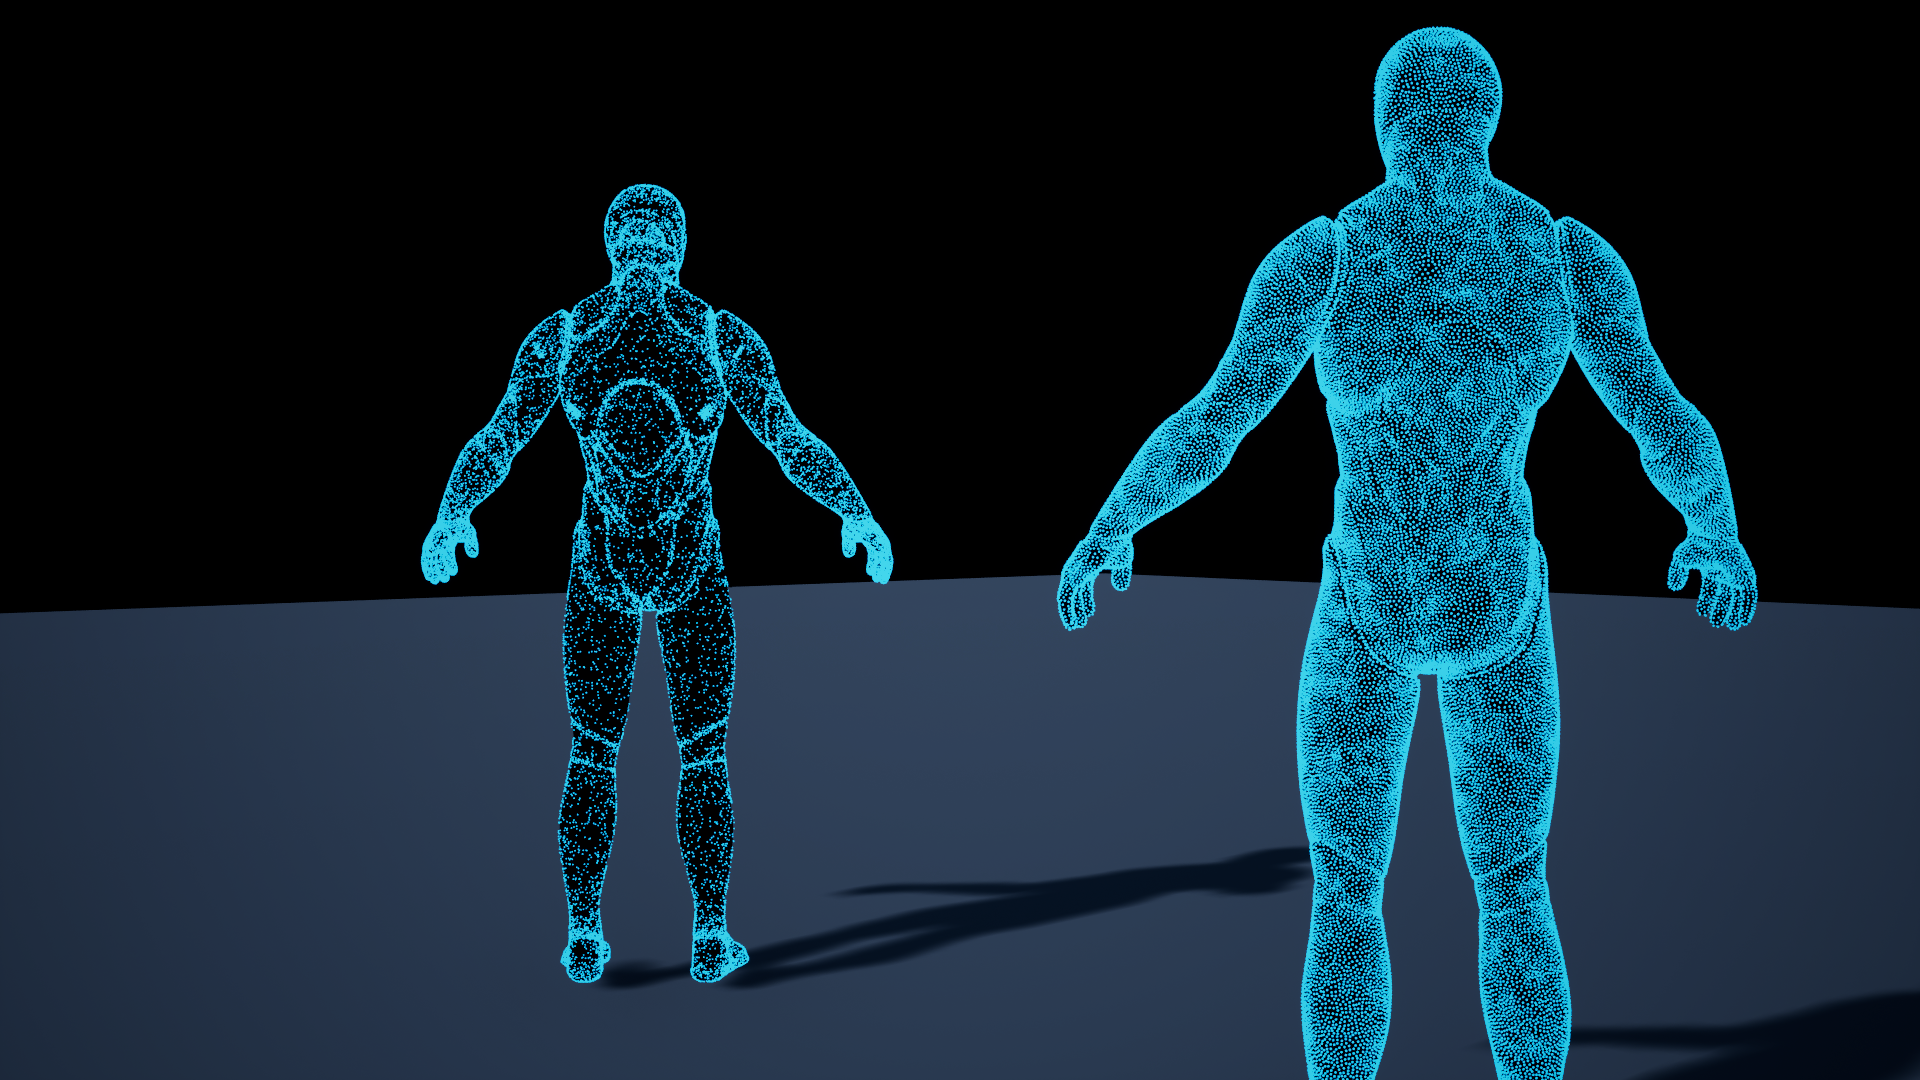
Ordinary random triangle selection also shows density bias from unequal triangle sizes. Area weighting addresses that bias; spacing relaxation addresses the remaining clusters and gaps.
Camera distances match the supplied framing, so apparent dot size is not the numerical measurement. Percentages come from captured particle positions. For timing comparisons, see Memory and runtime cost.